
Crude Oil And Financial Markets
Crude Oil and Financial Markets
WHAT HAS BEEN THE HISTORICAL RELATION BETWEEN OIL PRICES AND THE EQUITY MARKET?
For 1986–2015, the monthly correlation1 of the crude oil spot return with US stocks (represented by the CRSP 1–10 Index) was 0.02. The corresponding correlation with the MSCI World ex USA Index was 0.05. This indicates a weak historical relation. Over the past 10 years, oil prices have been quite volatile, and some of the large price swings coincided with moves in the same direction in stock markets. The result is an increased monthly correlation of oil with stocks over this period (0.33 for the US stock index and 0.37 for the MSCI World ex USA Index). Going forward, it is not clear whether these higher correlations will persist.
It is important to remember that these are contemporaneous correlations (the oil price change with the stock market return at the same time). In other words, they are not evidence of predictability. When many people ask about the relation between oil prices and the stock market, they are specifically asking whether falling oil prices are able to predict declines in the stock market. To examine this issue, it is necessary to look at the relation between previous oil price changes and subsequent market returns. Looking at the period 1986–2015, we calculated average monthly stock returns conditional on previous spot oil returns (see Exhibit 1). These average returns show no evidence that falling oil prices predict declining stock markets.

1Correlation is one way to measure how two variables move in relation to each other. Correlation coefficients range between −1 and +1, with +1 implying that the two variables move perfectly together, −1 implying that they move in complete opposite direction, and zero implying they move at random in relation to each other.
IS THE FALLING OIL PRICE DUE TO A SLACKENING IN DEMAND, WHICH COULD SIGNAL AN ECONOMIC SLOWDOWN?
Exhibit 2 shows that the US crude oil stock (inventory) has risen in recent months, from less than 360 million barrels in late September 2014 to more than 490 million barrels as of January 22, 20162. During that same time, the spot oil price has declined more than 60%. Exhibit 3 shows that this increase in the crude oil stock has not been due to slackening demand. Ignoring seasonal fluctuations, the amount of crude oil supplied to refineries has been steadily increasing since 2010. Instead, the noticeable increase in production, only partially offset by a decrease in imports, has been the catalyst for increased crude oil inventories.
Global supply and demand determines oil prices, and it is possible that these US statistics would not capture a reduction in the global demand for crude oil. For evidence of this possibility, Exhibit 4 uses worldwide liquid fuels consumption as a proxy for global oil demand. Using this proxy, once again there is no evidence of slackening demand in recent months. The exhibits do not allow us to make predictions about future crude oil demand. They simply provide evidence about recent demand, and the evidence suggests that demand has not fallen.

2Numbers exclude the US Strategic Petroleum Reserve (SPR). The same general pattern is seen if the SPR is included.


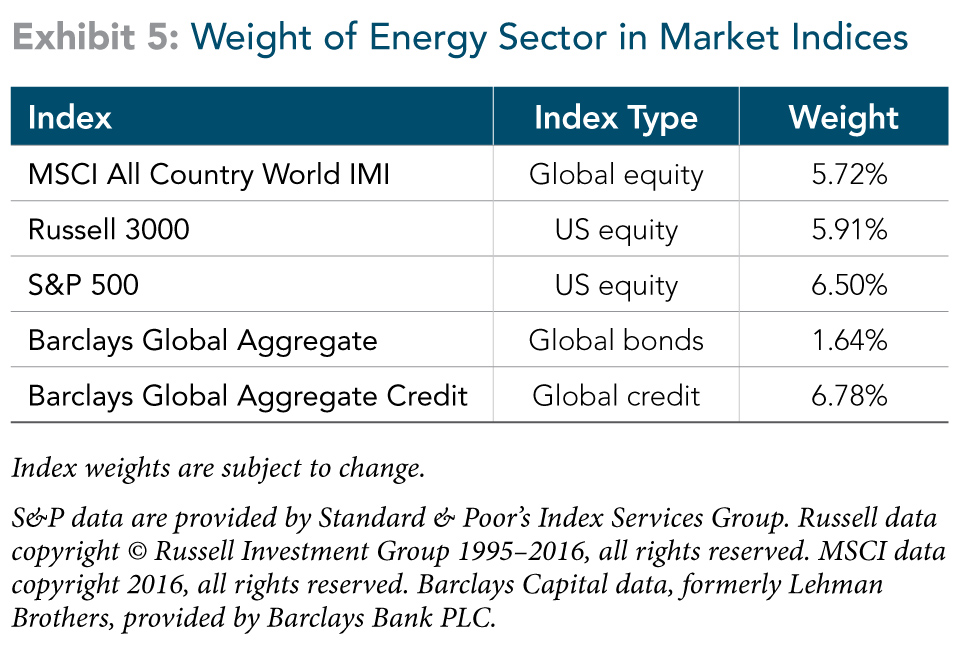
LOW OIL PRICES COULD EVENTUALLY RESULT IN DISTRESS FOR SOME FIRMS IN THE ENERGY INDUSTRY. HOW MUCH WEIGHT DO ENERGY FIRMS REPRESENT IN VARIOUS EQUITY AND FIXED INCOME INDICES?
As of December 31, 2015, the energy sector (including refineries and natural gas producers) had the following index weights:
Source: Dimensional Fund Advisors
Past performance is not a guarantee of future results. Indices are not available for direct investment; therefore, their performance does not reflect the expenses associated with the management of an actual portfolio. Investing risks include loss of principal and fluctuating value. Sector-specific investments can also increase these risks. There is no guarantee an investing strategy will be successful.
Dimensional Fund Advisors LP is an investment advisor registered with the Securities and Exchange Commission.